
 Mapping
the Brain
Mapping
the Brain![]()
![]() The
Brain is Electric...
The
Brain is Electric...
![]() The
History of the Electroencephalogram
The
History of the Electroencephalogram
![]() Building
Maps of the Mind
Building
Maps of the Mind
![]() Computers
and Brain Waves
Computers
and Brain Waves
![]() EEG Brain
Topography
EEG Brain
Topography
![]() The
Future
The
Future
![]() Internet Resources on Brain Mapping
Internet Resources on Brain Mapping
Technical developments in the field of electrical measurement and recording in the last quarter of the 19th century made possible one of the greatest triumphs of modern neuroscience: the discovery, made by a German psychiatrist named Hans Berger, that the human brain has a continuous electrical activity, and that it can be recorded (see the History of the Electroencephalogram).

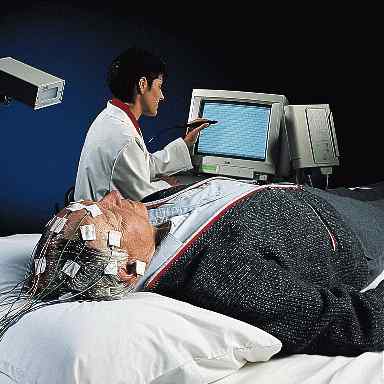
The electroencephalographic recording is usually taken by electrodes (small metallic discs) pasted by an electricity conducting gel to the surface of the skull's skin (scalp). A powerful electronic amplifier increases several hundreds or thousands of times the amplitude of the weak signal (less than a few microvolts) which is generated in this place. A device called galvanometer, which has a inkpen attached to its pointer, writes on the surface of a paper strip, which moves continuously at a fixed speed past it. The result is a wiggly "wave" like the picture above. One pair of electrodes usually make up a channel. EEG recordings, depending on its use, can have from 8 to 40 channels recorded in parallel. This is called multichannel EEG recording.
Since the times of Berger, it is know that the characteristics of EEG activity change in many different situations, particularly with the level of vigilance: alertness, rest, sleep and dreaming. The frequency and the amplitudes of waves change, and they have been labelled with names such as alpha, beta, theta and delta. Particular mental tasks also alter the pattern of the waves in different parts of the brain (See the article on the physiological basis of dreaming, in the last issue of Brain & Mind). Electroencephalograms are also used in neurology and psychiatry, mainly to help diagnose diseases of the brain, such as epilepsy (convulsions caused by a chaotic activity of neurons), sleep disorders and brain tumors.
An important application of multichannel EEG is to try to find the location of a epileptic focus (a small spot in the brain where the abnormal activity originates and then spreads to other parts of the brain) or of a tumor, even when they are not visible in a x-ray or CT scan of the head.
 A
32-channel EEG using a modern recorder.
A
32-channel EEG using a modern recorder.
Each horizontal tracing corresponds to an electrode pair placed on a particular area of the patient's scalp, forming a regular grid-like pattern.
By noting the set of channels where abnormal waves occurr (such as those marked in red), the neurologist is able to infer the parts of the brain where the abnormality is located. This is very difficult to scan and to interpret, and subject to many errors, however, when the number of abnormal channels is large, or the nature of changes is complex. A precise bidimensional location of a focus or tumor is impossible to achieve.
So, what is the solution ? The computer, of course.

 In order
to use the superior power and flexibility of the computer to store and
to analyze the EEG and other biosignals, an invention was of fundamental
importance: the so-called analog-digital converter (or DAC). Essentially,
it is an electronic device that takes a continuously variable wave and
transform it to a list of numbers (each number being a measurement of the
wave's amplitude at regular time intervals. These measurements are called
samples, so the whole process is also named sampling). Sampling
is performed at a high speed (100 to 200 times per second), and the resulting
numbers are stored onto the computer's disk. Each channel of EEG has its
own separate DAC process, in parallel with the others, and this proceeds
in real time.
In order
to use the superior power and flexibility of the computer to store and
to analyze the EEG and other biosignals, an invention was of fundamental
importance: the so-called analog-digital converter (or DAC). Essentially,
it is an electronic device that takes a continuously variable wave and
transform it to a list of numbers (each number being a measurement of the
wave's amplitude at regular time intervals. These measurements are called
samples, so the whole process is also named sampling). Sampling
is performed at a high speed (100 to 200 times per second), and the resulting
numbers are stored onto the computer's disk. Each channel of EEG has its
own separate DAC process, in parallel with the others, and this proceeds
in real time.
Once all the numbers which were recorded along a period of time are inside the computer, special software programs are used to display the waves in the video screen, print it out, etc. Mathematical techniques working with these large arrays of numbers are used to do filtering, frequency and amplitude analysis and color mapping. This approach is called quantitative EEG, because it's different from the traditional approach, which doesn't make any measurements on the tracings; instead, it relies on qualitative assessment or overall apperance of the patterns of waves.
 With
the possibility of recording simultaneously a great number of digitized
channels of EEG, a new technique was born: EEG brain topography,
at the end of the 80s. In this technique a large number of electrodes is
placed onto the head, following a geometrical array
of even-spaced points. A special software inside the apparatus' computer,
plots the activity on a color screen or printer, by coding the amount of
activity in several tones of color (for example, black and blue might depict
low EEG amplitude, while yellow and red might depict larger amplitudes).
The spatial points lying between electrodes are calculated by mathematical
techniques of interpolation (calculating intermediary values on the basis
on the value of its neighbors), and thus a smooth gradation of colors is
achieved.
With
the possibility of recording simultaneously a great number of digitized
channels of EEG, a new technique was born: EEG brain topography,
at the end of the 80s. In this technique a large number of electrodes is
placed onto the head, following a geometrical array
of even-spaced points. A special software inside the apparatus' computer,
plots the activity on a color screen or printer, by coding the amount of
activity in several tones of color (for example, black and blue might depict
low EEG amplitude, while yellow and red might depict larger amplitudes).
The spatial points lying between electrodes are calculated by mathematical
techniques of interpolation (calculating intermediary values on the basis
on the value of its neighbors), and thus a smooth gradation of colors is
achieved.
This approach gives a much more accurate and representative view of the location of alterations of rhythm, amplitude, etc., in relation to i the surface of the skull. Neurologists working with the EEG brain topographic system were soon able to differentiate several kinds of diagnoses (including some mental diseases whose biological origin, or ethiology, was previously unknown). Pinpointing the exact location of EEG alterations was also made much more easier. In addition, the use of the cinè mode (animations using several sequential pictures taken from the brain maps) made possible the dynamic study of brain function in action.
EEG brain topography is not performed in all cases requiring a recording of the brain activity. Its main indication is to determine the presence of tumors and focal disease of the brain (including epilepsy, arteriovenous mal-formations and stroke). It is also appropriate when disturbances in consciousness and vigilance are present, such as narcolepsy (the abrupt onset of sleep), coma, etc.. In addition, EEG brain topography is being increasingly used to monitor the effects of withdrawal of psychoactive drugs, and in infectious diseases of the braim, such as meningites, as well as to follow up patients who where subjected to brain operations. In psychiatry, EEG brain topography has been of value in identifying disorders of biological origin, such as schizophrenia, dementias, hyperactivity and depression, brain atrophy and attention deficit disorders in children.

 Today,
there are many commercial EEG brain topography systems in use. They are
generally installed in PC- or Macintosh-based microcomputer platforms,
and can be easily operated by technicians or physicians, due to the Windows-based
software which comes with the package. This software is highly flexible,
permitting the programming of many recording configurations and parameters,
as well as to build a reference database of images, composed of typical
patient cases in several pathologies. Usually, the multichannel records
can be shown side by side with the reconstructed topographical brain map.
In addition, several maps taken in different epochs can be displayed
side by side.
Today,
there are many commercial EEG brain topography systems in use. They are
generally installed in PC- or Macintosh-based microcomputer platforms,
and can be easily operated by technicians or physicians, due to the Windows-based
software which comes with the package. This software is highly flexible,
permitting the programming of many recording configurations and parameters,
as well as to build a reference database of images, composed of typical
patient cases in several pathologies. Usually, the multichannel records
can be shown side by side with the reconstructed topographical brain map.
In addition, several maps taken in different epochs can be displayed
side by side.
See also The Future of EEG Brain Mapping.
See also the list of Internet Resources on EEG Brain Mapping
Picture credits: Siemens Medical Systems, Nicolet Instrument Co., Electrical Geodesics, Inc., Technical University of Graz, Austria, Stanford Research Institute, Medelec, Walter GraphTek, NeuroScan, Inc
The Author
|
Renato M.E. Sabbatini
is a neuroscientist with a PhD in neurophysiology of behavior by the University
of São Paulo, Brasil, and a post-doctoral fellow in the Department
of Behavioral Physiology of the Max-Planck Institute of Psychiatry, Munich,
Germany. Currently, Dr. Sabbatini is the director of the Center
for Biomedical Informatics and Chairman of Medical Informatics of the
Medical School of the State University
of Campinas, Campinas, Brazil. He is also the associate editor of "Brain
& Mind" magazine, and editor-in-chief of Informédica and Intermedic,
a journal on Internet and Medicine. Email: sabbatin@nib.unicamp.br |
 1 of 4 pages |